

Skip to content
  • OverviewSee how a reading travels from your site to your screen: read-only, isolated, sealed and shown with its coverage.
  • ArchitectureThe architecture Axiom Logic is being built to: a target, shown whole, with the state of every part.
  • All industriesSix industrial contexts, the problems published research finds in each, and what Axiom Logic would measure.
  • ManufacturingThe plant already records the answer. It is rarely in one place.
  • Cold chain & distributionA temperature log is only useful if it can be believed.
  • Commercial propertyTenants, lenders and regulators now ask for the meter, not the brochure.
  • Energy & utilitiesDemand is changing faster than the data used to plan for it.
  • Water & agricultureWater that is not measured cannot be accounted for.
  • Fuel terminalsWhat came in, what went out and what is in the tank should agree.
  • All service linesFive evidence-led service lines for industrial energy, demand, IIoT, measurement and analysis.
  • NMD and demand advisory
  • Tariff, solar and storage advisory
  • IIoT solutions
  • Measurement and verification
  • Evidence-linked AI analyst
  • PricingEssential, Professional and Enterprise package prices in ZAR, excluding VAT.
GuidesCompany
Sign inContact sales
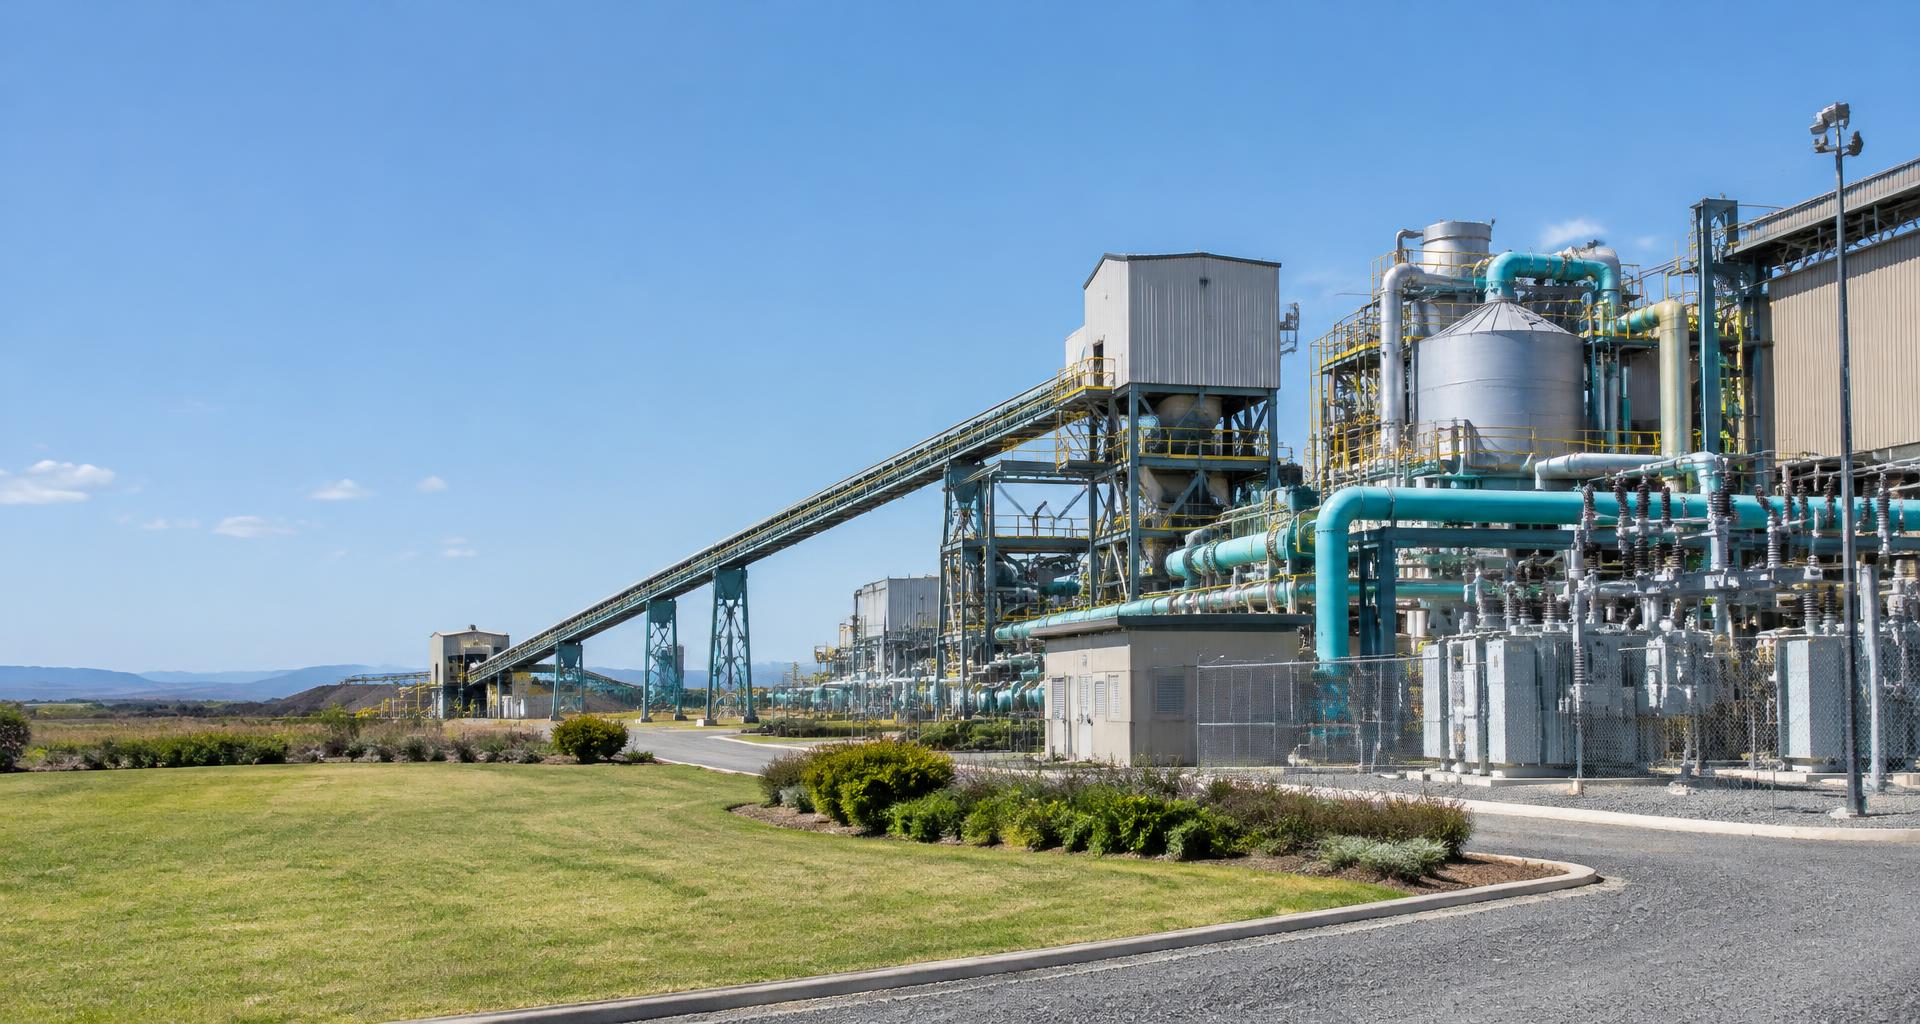
Illustrative industrial facility with process pipes, electrical equipment and conveyors

From the plant floor to the boardroom

Axiom Logic

Every site. One truth.

Your sites have different systems. Your decisions need a common basis. Follow the reading from its source — with its units, time, gaps and evidence still attached.

Tell us about your siteSee the method

Read only. Your people stay in control of plant.

Illustrative scene · not a customer site

One platform. The whole site.

From telemetry to the decision it supports.

Integrations, historian, alarms, energy, AI analysis and checkable statements — across five service lines. Not an energy dashboard in isolation.

One console

Granted module by module.

You see only the modules your workspace has. Add one when you need it.

Evidence architecture

A gap is a result, not an invitation to guess.

How we start

From first conversation to first reading.

Straight answers

The questions everyone asks.

Questions we answer in plain language

The reason for Axiom Logic

We do the proving. You do the deciding.

A common basis for decisions is built from declared scope, measurements and dated records. Tell us about your site, its systems and the decision you need to make.

Tell us about your site
Axiom Logic

Services

NMD and demand advisoryTariff, solar and storage advisoryIIoT solutionsMeasurement and verificationEvidence-linked AI analyst

Company

PlatformArchitectureFor leadershipIndustriesGuidesCompanyDoctrine

Connect

PricingContactSign in
PrivacyTerms of usePAIA manualCookiesTransfer register

© 2026 Cynvest Investments (Pty) Ltd · Registration number 2019/505152/07 · trading as Axiom Logic

  • Pr Tech Eng

    Led by an ECSA-registered engineer, no. 201470162 (opens in a new tab)

  • 5

    Service lines on one evidence chain

  • Read-only

    No path back to your equipment

  • SAST

    South African tariffs, seasons and time

Why the numbers disagree

Many sites. Many systems.

Different suppliers. Different commissioning dates. Different spreadsheets.

  • Site AEnergy meter
    Source register415.78567 kWh
    Exact conversion0.41578567 MWh
    Rounded report0.416 MWh
  • Site BTank volume
    Source register12.34567 m³
    Exact conversion12,345.67 L
    Rounded report12,346 L
  • Site CKiln temperature
    Source register183.456 °C
    Exact conversion183.456 °C
    Rounded report183.5 °C
  • Site DConveyor checkweigher
    Source register24.98765 kg
    Exact conversion24.98765 kg
    Rounded report24.99 kg
  • Site ECompressed-air pressure
    Source register687.432 kPa
    Exact conversion6.87432 bar
    Rounded report6.87 bar
  • Site FFermentation pH probe
    Source register6.87321 pH
    Exact conversion6.87321 pH
    Rounded report6.87 pH

Many versions of the truth.

Illustrative handovers · not customer sites or records

Why the numbers disagree

One reading. Five ways to break it.

The same reading can lose its meaning before it reaches the people who need to decide.

Source415.78567 kWhIllustrative energy meter
0.41578567 MWhDeclared conversionIllustrative energy meter
0.416Unit and scale missing
×

Where trust breaks

Units that do not match

An energy reading changes its appearance when kilowatt-hours become megawatt-hours. Without the unit, scale and declared precision, a valid conversion can become a misleading report.

What needs to stay with the reading

Declare the quantity, unit and scale. Keep the source value and the interpretation distinguishable.

Illustrative handovers · not customer sites or records

Where did this number come from?

Copied. Rounded. Argued over.

By the time the figure reaches a meeting, nobody can explain its source or correction history. It gets argued over instead of acted on.

Source value415.78567 kWh07:15:00 UTC
Source path missing
Exported415.78567 kWhSource + time attached
Pasted415.78567 kWhSource link detached
Rounded415.78567 kWhPrecision reduced
Renamed415.78567 kWhQuantity renamedReported total
Trace the sourceSource path missing

Not acted on.

Illustrative handovers · not customer sites or records

What needs to stay with the reading

Follow available evidence back through the statement, receipt and source. Where that path is missing, say so.

Keep the plant. Connect the evidence.

Read-only, from plant floor to boardroom.

Read through the systems a site already has. Axiom observes; it never writes to a PLC, inverter, battery, setpoint or breaker. Site operators keep the controls.

  • Meters
  • Control systems
  • Inverters and generators
  • Gateways
Site edgeRead-only

Axiom Logic

  1. Receive
  2. Hash and compareShows unchanged bytes, not a correct reading.
  3. Check
  4. Keep
  • Site managers
  • Executives
  • The board
No write-back to plant
Illustrative information flow · not live transmission

Connections and interpretations are declared before data is used as a record. Held data does not become a measurement by appearing on a screen.

How data moves

From the meter on the wall to the number on your screen.

Follow one reading through the seven places it passes, or choose a station.

01 Instrument02 Control03 Edge04 The link05 Ingest06 Historian07 Your screen

01 · Instrument · the meter on the main incomer

Your equipment

A measurement with a known error

The reading starts at an instrument the site already owns: here a class 0.5S energy meter on the main incomer, measuring apparent power through 800/5 current transformers.

What Axiom keeps here: which instrument, its accuracy class and its range, so every figure later carries the error it was measured with.

What goes wrong here. A drifting sensor reads wrong for weeks. The accuracy class and range travel with the figure, so the error stays visible.

Read only. The platform never writes to plant.

Read the IIoT page

The reading at this point

meter M-01 · main incomer

S = 412.6 kVA

CT 800/5 · accuracy class 0.5S

Illustration. One demand reading from a fictional site, not a measurement from a plant and not a claim about speed. Field names follow the payload specification.

  1. 01

    Read only by design

    The platform observes plant. It never writes to a PLC, inverter, battery, setpoint or breaker.

  2. 02

    A receipt for every message

    Accepted or refused, every message gets a receipt and its bytes are kept exactly as they arrived.

  3. 03

    Corrections, never overwrites

    A correction is a new entry beside the old one. Nothing sealed is edited or deleted.

  4. 04

    Verify it yourself

    Statements are hashed so anyone can check them in the browser without trusting Axiom.

Fix the break at its source

A reading needs more than a value.

Units, time, coverage and provenance belong beside the number — not in a separate spreadsheet that gets lost on the way up.

Received at the door415.78567 kWh
Declared interpretation0.41578567 MWh

Received at the door

Source device
Illustrative energy meter
Quantity
Energy
Source unit
415.78567 kWh
Source time
2026/10/01, 09:15:00 SAST
Arrival time
2026/10/01, 09:15:03 SAST
Coverage
Not gradeable
Record state
Held until classified

Declared interpretation

Source device
Illustrative energy meter
Quantity
Energy
Declared unit
0.41578567 MWh
Source time
2026/10/01, 09:15:00 SAST
Arrival time
2026/10/01, 09:15:03 SAST
Coverage
Not gradeable
Record state
Only admitted data supports records

Illustrative example · not a measurement

An illustrative conversion is not an admitted client reading. Time checks and coverage can still refuse the result.

The gap and the correction stay visible.

Missing data is not zero. A correction leaves its history. Available statements can be checked independently; a screen alone is not proof.

Mains incomer · 14:00 to 15:0050 of 60 minutes
A missing hour stays missing.

Illustrative example · not a measurement

  • 412.0 kVA · issued 02 Sep 08:00
  • 418.6 kVA · correction 03 Sep 10:15

Illustrative example · not a measurement

For site and operations managers

What is happening now. Who needs to act.

See plant readings, connection health and alarm conditions together. An alarm needs named responsibility — and its acknowledgement, condition clearing and task closure must remain separate recorded acts.

Plant readings · illustrative

Pump 3 · discharge pressure

4.12bar

Full

as of 14:32 SAST

Tank 1 · level

71.4%

Full

as of 14:32 SAST

Cold room 2 · temperature

-18.6°C

Partial

as of 14:31 SAST

Main meter · demand

742.6kVA

Partial

as of 14:30 SAST

Illustrative example · not a measurement

Alarm lifecycle · illustrative

Compressor 2 · discharge temperature high

  1. Raised09:12:04
  2. Acknowledged09:14:37
  3. Cleared09:41:10
  4. Closed09:52:48

Illustrative example · not a measurement

Delivery is a recorded status, not a promise of arrival. A cleared condition does not prove the work is signed off.

For executives

Economics. Throughput. What is coming.

Compare on declared boundaries, not matching spreadsheet headings. Energy and demand costs, production and planned shutdowns belong in the same decision — with their limits visible.

Economics

Relate energy and demand to the tariff in force. Avoided cost stays modelled until supported by issued M&V statements.

Economics

Last month
96 % of budget
Same month a year earlier
101 % of budget

Illustrative example · not a measurement

Throughput

Compare production and energy per unit only when the production definition, site period and available readings support it.

Throughput

Last month
50 kt
Same month a year earlier
45 kt

Illustrative example · not a measurement

Maintenance outlook

Show declared shutdown plans separately from observed downtime. An outlook is not a guaranteed prediction.

Maintenance outlook

Last month
2 shutdowns
Same month a year earlier
3 shutdowns

Illustrative example · not a measurement

These illustrations describe the intended executive and board views, not a claim that those views are in service.

For the board

Seven charts. Month on month.

Designed to be read in five minutes. Keep the few figures that change a decision, with a route back to supporting evidence where it exists.

Energy cost

Last month
96 % of budget
Same month a year earlier
101 % of budget

Illustrative example · not a measurement

Maximum demand against NMD

Last month
90 % of NMD
Same month a year earlier
98 % of NMD

Illustrative example · not a measurement

Throughput

Last month
50 kt
Same month a year earlier
45 kt

Illustrative example · not a measurement

Energy per unit produced

Last month
288 kWh/t
Same month a year earlier
307 kWh/t

Illustrative example · not a measurement

Availability

Last month
96 %
Same month a year earlier
93 %

Illustrative example · not a measurement

Planned shutdowns

Last month
2 shutdowns
Same month a year earlier
3 shutdowns

Illustrative example · not a measurement

Solar and storage · share of energy cost

Last month
6 % of energy cost
Same month a year earlier
0 % of energy cost

Illustrative example · not a measurement

Illustrative comparisons · not customer results. Missing evidence remains unavailable, not zero.

Explore the leadership views

FOR LEADERSHIP

Many sites. Seven charts. Designed to be read in five minutes.

Managers see every site. Executives see economics, engineering and maintenance. The board sees at most seven charts, month against month.

See how
  • Illustrative example · not a measurement

    Demand

    Understand what drives the peak, what the supply agreement permits, and what the evidence supports.

    The method is still to be issued. This service line is not yet proved.

  • Illustrative example · not a measurement

    Energy advisory

    Price measured energy against the rate in force and examine solar or storage plans without turning a model into a saving.

    The methods are still to be produced. This service line is not yet proved.

  • IIoT solutions

    A platform being built to bring readings from meters, machines and control systems at every site into one place, with alarms that reach a named person, energy priced at the tariff in force, and data faults shown as faults. Every part says whether it is live yet.

    Live, being built, specified or planned—computed from the public Architecture page.

  • Illustrative example · not a measurement

    M&V

    A written Option C method for testing a whole-facility result while preserving every refusal, input and correction.

    Method issued. The engine is not built and the service line is not proved.

  • Illustrative example · not a measurement

    AI analyst

    Ask a plain-language question and require the answer to cite the series, window, coverage and document it rests on.

    The policy is still to be produced. This service line is not yet proved.

  • Overview
  • Assets
  • Alarms
  • Dashboards
  • Trends
  • Analysis
  • AI analystPlanned

Compressor 2 · discharge temperature high

  1. Raised09:12:04
  2. Acknowledged09:14:37
  3. Cleared09:41:10
  4. Closed09:52:48

Illustrative example · not a measurement

Designed and being built. Nothing here is in service yet.

  1. Observe. Read-only acquisition keeps advice separate from plant control.
  2. Qualify. Coverage, source and modelled status travel with every figure.
  3. Record. Receipts and fingerprints close the claim without erasing history.

Observe

Qualify

Record

Observe

Read-only acquisition keeps advice separate from plant control.

  1. 01

    Tell us about your siteA few short questions.

    An engineer reads every answer and replies within 2 working days if you ask for a reply.

  2. 02

    We walk your site with youWhat you run, what already measures it, what you need to prove.

    You get a plain list: where the evidence is strong, where the gaps are, and what closing them takes.

  3. 03

    Connect, read-onlyYour PLC, meters, sensors or files.

    Each connection has its own credential and writes into your workspace only. Nothing is written back to site.

  4. 04

    Declare, then go liveEach reading is confirmed before it counts.

    A reading from a device nobody has confirmed is stored, but never used in a figure.

Tell us about your site
  • Manufacturing

    The plant already records the answer. It is rarely in one place.

  • Cold chain & distribution

    A temperature log is only useful if it can be believed.

  • Commercial property

    Tenants, lenders and regulators now ask for the meter, not the brochure.

  • Energy & utilities

    Demand is changing faster than the data used to plan for it.

  • Water & agriculture

    Water that is not measured cannot be accounted for.

  • Fuel terminals

    What came in, what went out and what is in the tank should agree.

No. The platform reads what your equipment already reports. Your control system keeps doing its job.

No. There is no path from the platform back to your equipment. We observe; we never switch, set or control anything on site.

The gap stays a gap. The figure shows lower coverage, the device is flagged silent, and the edge agent stores and forwards through an outage.

Your people, in your workspace. Each customer's data sits behind row-level isolation. A missing permission is refused, not quietly widened.

A statement is written one exact way and fingerprinted, and each day's statements are sealed together. A correction is a new, visible record.

It is designed and being built. Nothing here is in service yet. Tell us about your site and we will tell you plainly what is ready.

  • What is NMD on an Eskom supply, how do you reduce it, and what happens if you go over it?
  • How do Eskom's main business tariffs differ?
  • Why does the bill count demand in kVA, and what does power factor change?
  • What are peak, standard and off-peak periods, and when is the high-demand season?
  • Which charges depend on the highest half-hour, and which on capacity?
  • How is an energy saving established, if a meter cannot read it?